
Understanding your hardware architecture is a prerequisite for optimizing modern workflows, especially when deploying local AI models or resource-intensive software. Whether you are troubleshooting performance bottlenecks or verifying compatibility for high-end rendering, identifying your GPU (Graphics Processing Unit) specifications on Windows 10 and 11 is a streamlined process. Here are the most efficient methods to extract this data using native system tools and automation commands.
Method 1: Utilizing the Windows Task Manager for Real-Time Monitoring
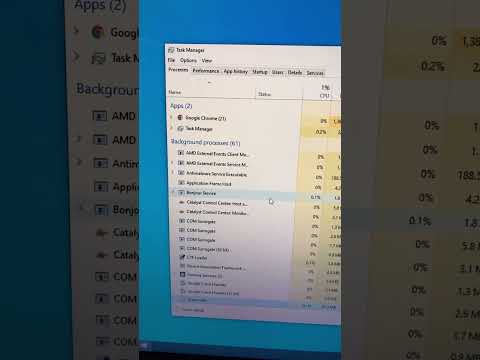
The Task Manager provides a high-level overview of your GPU's current utilization and hardware identification. This is the fastest method for a quick status check.
1. Press Ctrl + Shift + Esc to launch the Task Manager.
2. If the window is compact, click "More details" at the bottom.
3. Navigate to the "Performance" tab.
4. Select "GPU" from the left-hand sidebar. (If your system has both integrated and discrete graphics, you will see GPU 0 and GPU 1).
5. In the top-right corner, the specific model name (e.g., NVIDIA GeForce RTX 4070) will be displayed. The bottom section provides data on Dedicated GPU Memory (VRAM), which is critical for AI training and inference tasks.
Method 2: Deep Inspection via DirectX Diagnostic Tool (DxDiag)
For a more comprehensive technical report, including driver versions and feature levels, the DirectX Diagnostic Tool is the industry standard for Windows environments.
1. Press Windows Key + R to open the Run dialog box.
2. Type "dxdiag" and hit Enter.
3. Navigate to the "Display" tab (or "Display 1" / "Display 2").
4. Under the "Device" section, you will find the chip type, DAC type, and total estimated memory. This tool is particularly useful for identifying WHQL driver signatures, ensuring system stability for automated software deployments.
Method 3: System Information (msinfo32) for Hardware Documentation

When you need to export your system specs for technical support or AI hardware auditing, System Information offers a granular view that can be saved as a text file.
1. Press Windows Key + S and search for "System Information".
2. Expand the "Components" category in the left pane.
3. Click on "Display".
4. Here, you will find the Adapter Description, Adapter RAM, and Installed Drivers. This method is preferred by system administrators for documenting hardware across multiple nodes in a network.
Method 4: Command-Line Automation (PowerShell)
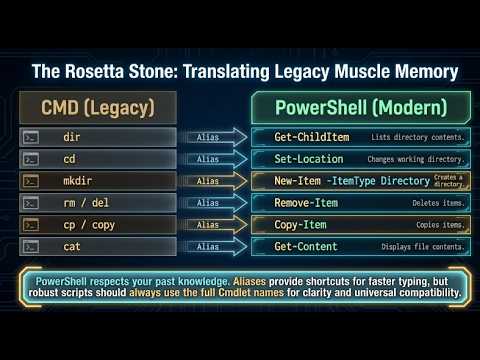
For users looking to automate hardware detection or query specs via scripts, PowerShell provides a direct interface to the Windows Management Instrumentation (WMI).
1. Right-click the Start button and select "Terminal" or "PowerShell".
2. Enter the following command: Get-CimInstance Win32_VideoController | Select-Object Name, AdapterRAM, DriverVersion
3. This will output a clean string containing the GPU name and driver version, allowing for rapid assessment without navigating through GUI menus.
AI Implementation Score
The following table evaluates these methods based on their efficiency for users managing AI-heavy workloads or software automation.
| Method | Efficiency | Data Depth | Automation Potential |
|---|---|---|---|
| Task Manager | High | Medium | Low |
| DxDiag | Medium | High | Medium |
| System Info | Medium | Very High | Medium |
| PowerShell | Very High | Customizable | Very High |
Checking your graphics card specs is the first step in ensuring your Windows 11 or 10 PC is optimized for the next generation of software. By utilizing these native tools, you maintain system integrity while gaining the insights needed for professional-grade performance tuning.
